![MXQS304 eLearning Curriculum Sample Describing How to Interpret a Control Chart and Diagnose Hugging by Splitting Zones MXQS304 eLearning Curriculum Sample Describing How to Interpret a Control Chart and Diagnose Hugging by Splitting Zones](https://amatrol.com/wp-content/uploads/2022/01/1-MXQS304-eLearning-Curriculum-Sample-Describing-How-to-Interpret-a-Control-Chart-and-Diagnose-Hugging-by-Splitting-Zones.png)
Requires:
- Computer (see Computer Requirements)
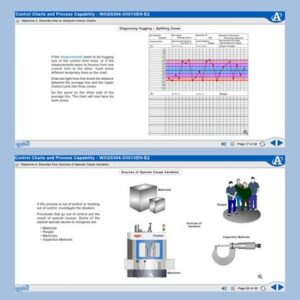
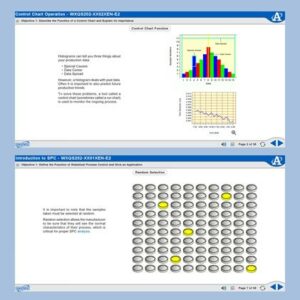
Statistical Process Control 2 eLearning builds on the key concepts of SPC, delving deeper into control charts and interpreting sources of variation. Learners look at assignable and system causes of variation. They gain experience in interpreting SPC data and determining process capability.